

A steady decline in operational performance was driven by high employee turnover, lack of focus, and overall poor communication across business functions. Visualizing the process helped spark change including a 20% decrease in lead-time and a 90% reduction in obsolete stock.
Story
The client produces engineered-to-order industrial valves for global markets into safety-critical fluid processes for several industry sectors. Skills, knowledge and company culture began to erode over several years as experienced employees left and were replaced by new hires. This led to significant disruption in the end-to-end, order-to-delivery lead time, which in turn impacted customer satisfaction, quality, volumes and overall employee motivation.
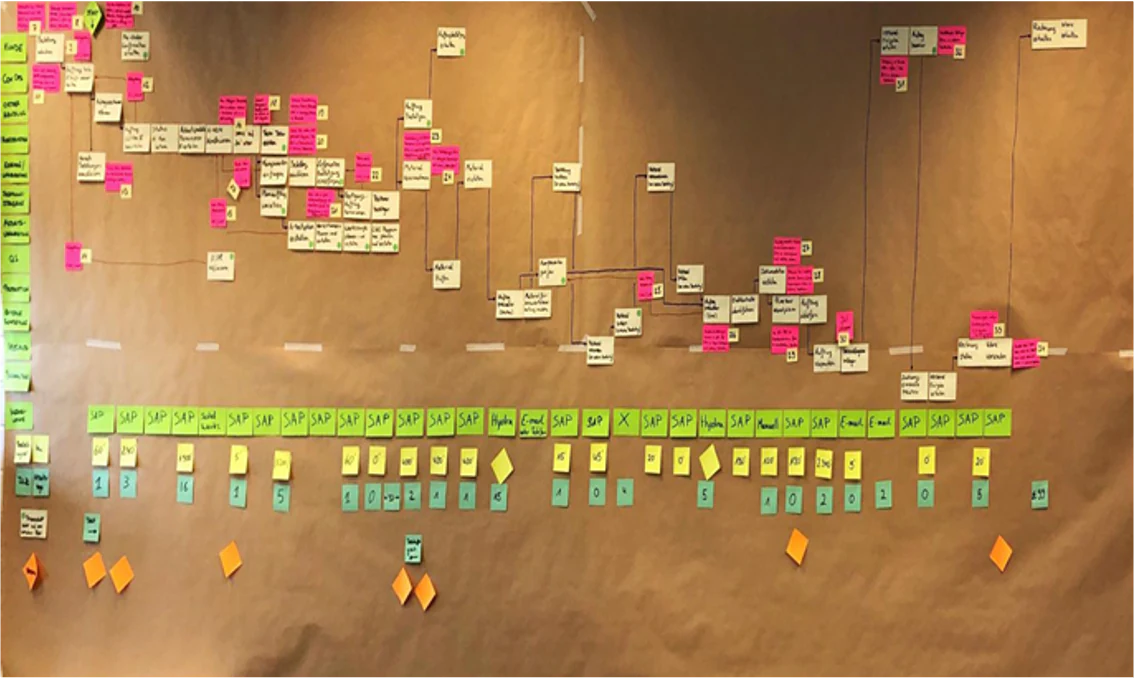
During an eight-week analysis the end-to-end cross-functional supply chain was visualized using Value Stream Mapping workshops, performance data analytics, validated quality gates and KPIs through the whole order execution process. The analysis revealed that high workforce turnover had affected the skills in engineering, quality assurance, technical quotations, sales, and customer service. Process mapping identified lead time reduction opportunities.
The Value Stream Mapping approach, which emphasized a high level of cross-functional employee engagement, helped establish a streamlined process, daily communication and data-driven KPIs that improved operational and financial performance.
Conclusion
Visualization, daily use of KPIs, greater process focus, stronger cross-functional communication, and improved quality all drove a change in behavior and overall performance.
- Lead time reduced by 20%
- Obsolete stock reduced by 90%
Daily KPI meetings helped teams track customer orders across departments.